

Application Overview
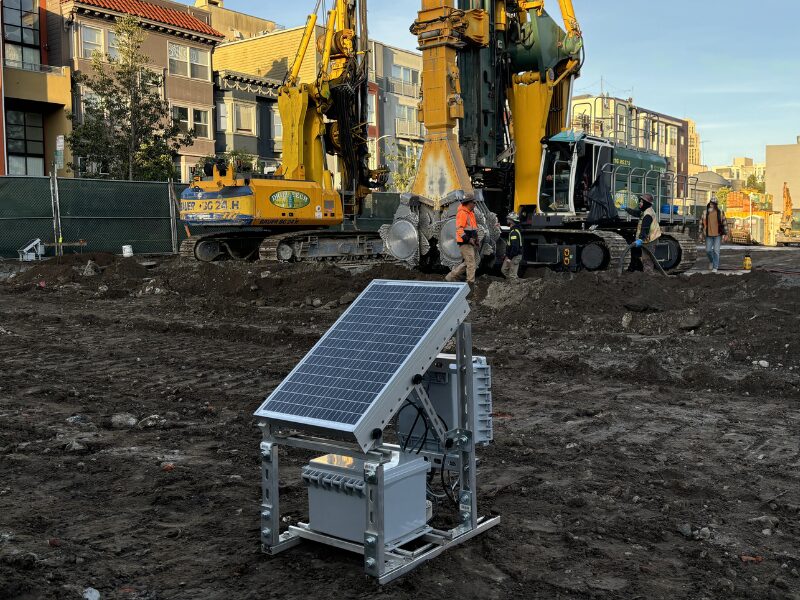
Geodaq provides complete vibration monitoring systems and services for construction, blasting, pile driving, demolition, and structural response monitoring. Our portable remote stations support ground vibration monitoring with ISEE- or DIN-compatible geophones and Geodaq GEO3 tri-axial velocity transducers, which are available with either geophone or MEMS sensor elements.
Each station provides high-resolution data acquisition, PPV, dominant frequency, waveform capture, FFT results, real-time alerts, and automatic PDF reporting. Battery- and solar-powered stations operate continuously in the field and transmit results to a secure cloud server for remote review.
Services include field installation, remote system configuration, threshold notifications, instrumentation plans, report generation, and technical support for interpreting vibration results.
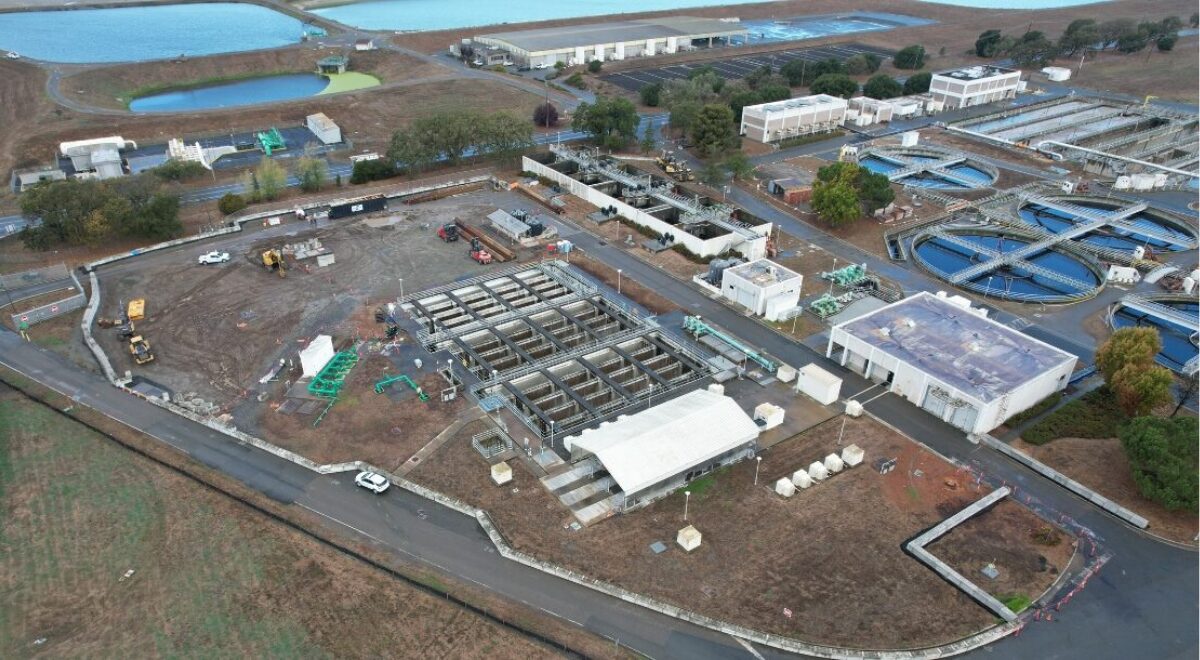
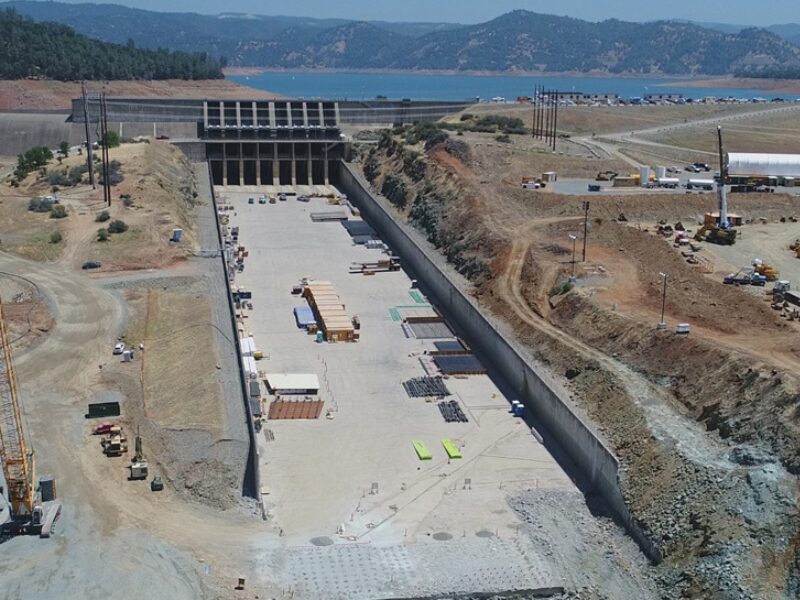
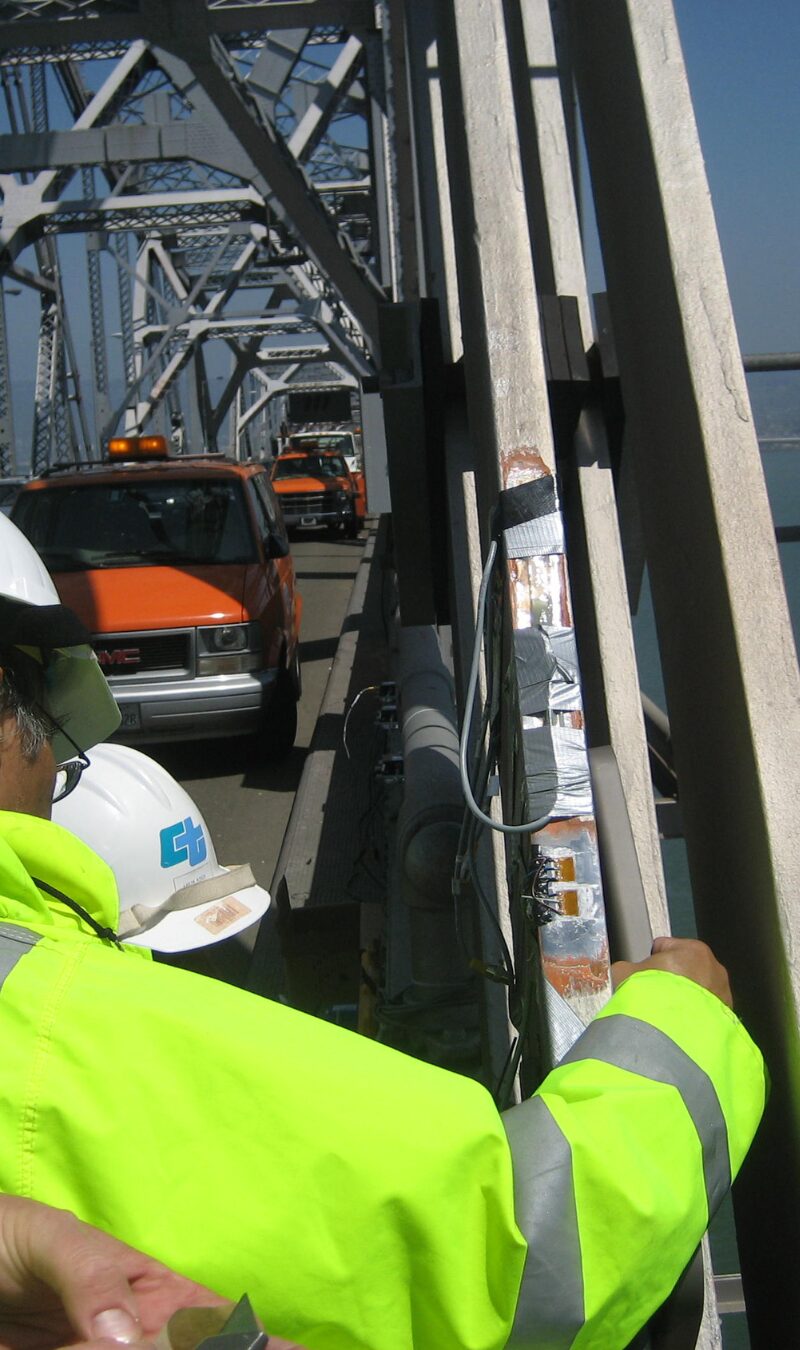
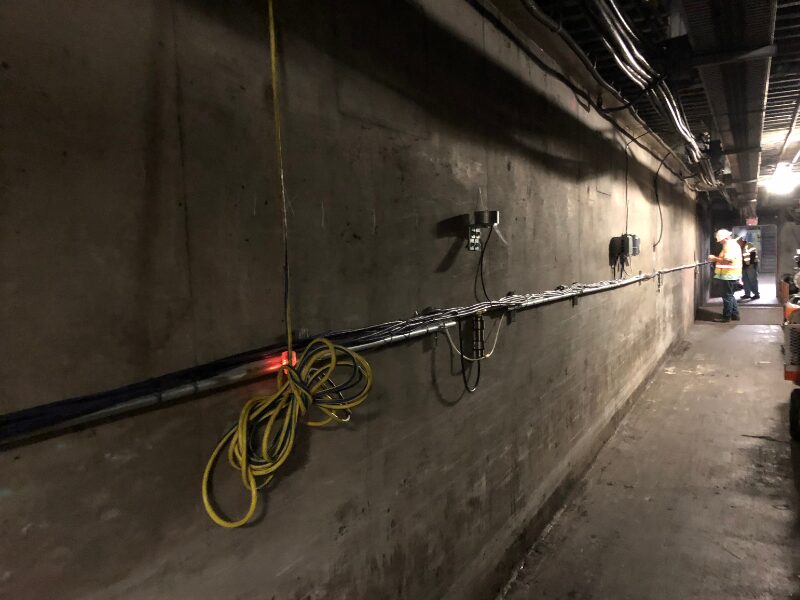
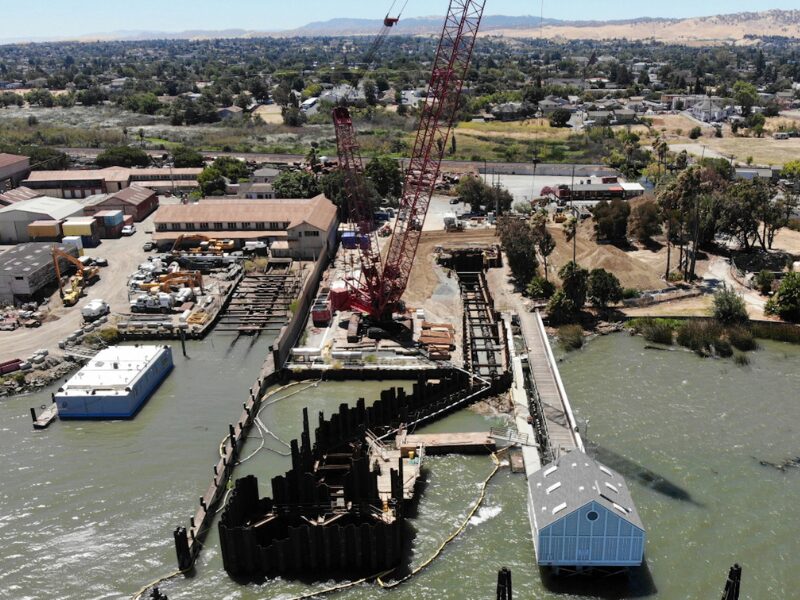
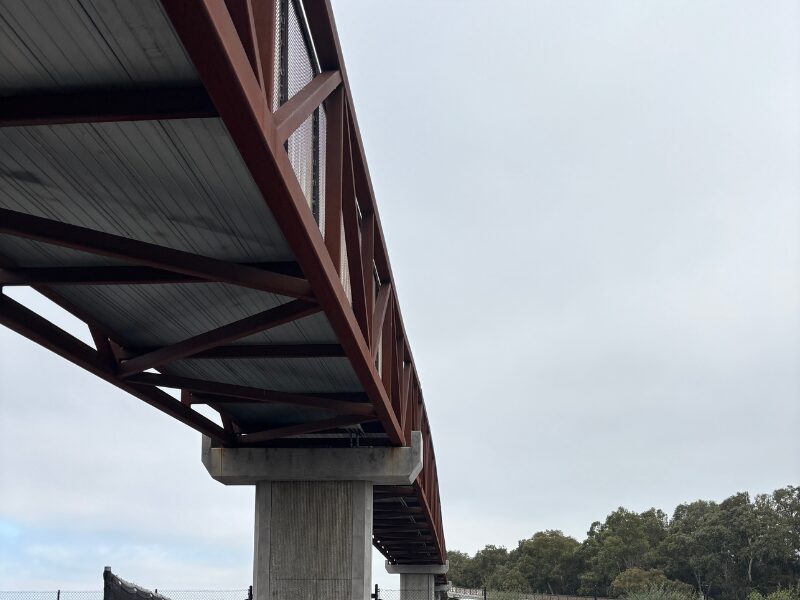
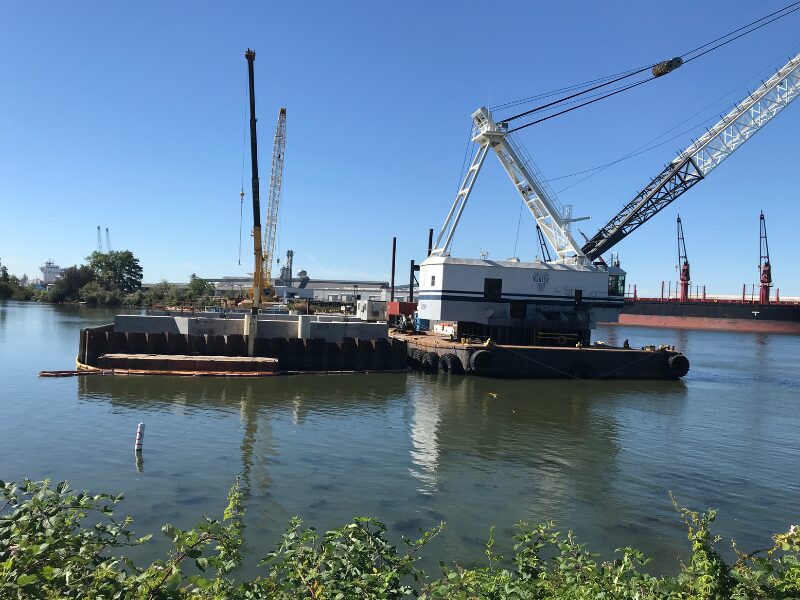
The project examples below highlight Geodaq vibration monitoring systems deployed for construction, blasting and structural response applications.

Real-Time Vibration Monitoring Services
Geodaq monitoring services include field instrumentation, remote data collection, real-time alerts, and technical support for interpreting vibration results. Systems can be configured for ground vibration, structural vibration, high-frequency strain, displacement, or acceleration monitoring associated with blasting, impact loading, heavy construction, and structural response.
Results are available through a secure web application with complete time-history plots, waveform records, FFT results, dominant frequency measurements, and comparison to project-specific criteria.
Oroville Dam Blast Monitoring
Remote Monitoring Stations
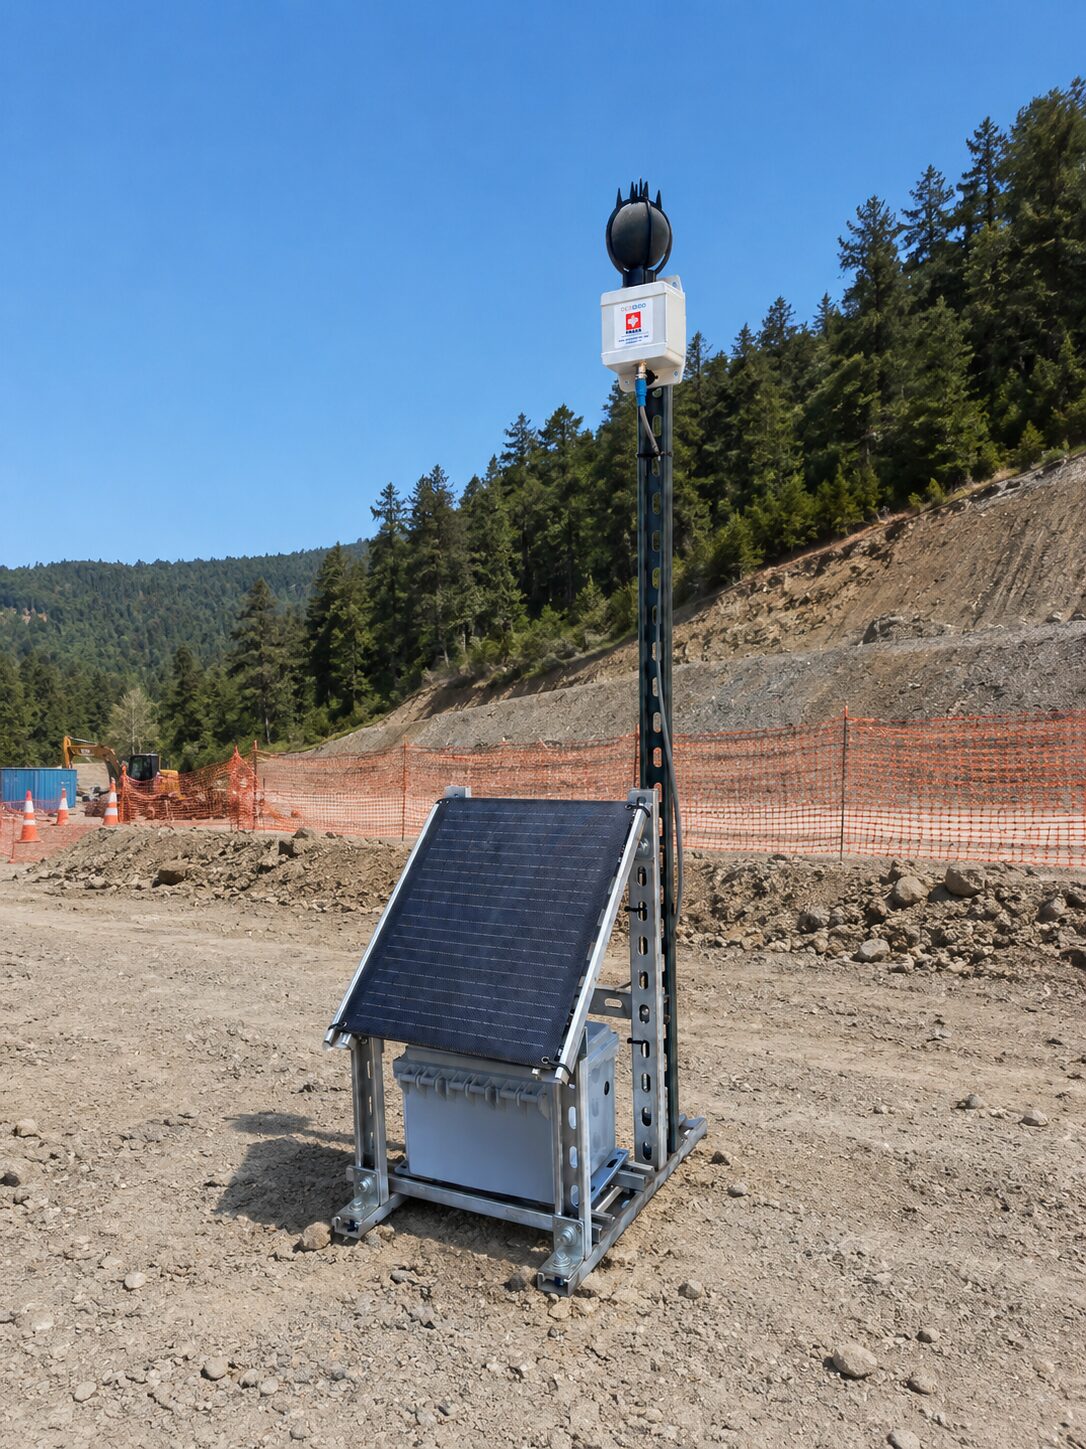
Geodaq remote monitoring stations are portable, rugged, and designed for continuous unattended operation at active construction sites. Each station can be configured with one or more tri-axial geophones for ground vibration monitoring or SS6 structural vibration modules for direct mounting to buildings, structures, or equipment.
Stations include high-resolution data acquisition, wireless communications, battery power, solar charging, and environmental health monitoring. Data is automatically transmitted to a secure cloud server for remote review, reporting, and alerting.
Station Features
Web Results, Alerts and Reports
Our automated monitoring service provides real-time access to vibration results through a password-protected web portal. Users can view station locations on a map, check system health, review vibration and noise data, and generate up-to-date PDF reports.
Vibration results can be filtered by time period and reviewed using project-specific criteria, threshold levels, and selectable frequency filters. Reports can include PPV, dominant frequency, waveform records, FFT plots, exceedance summaries, and station health information.
Web Application Capabilities